MINER’S EQUATION : INTRODUCTION TO CUMULATIVE DAMAGE IN FATIGUE
MINER’S EQUATION :Till now, we dealt with stresses that acted on the system in a single stress cycle. In practical analysis, especially in high stress applied tasks, the stress acts in PARTICULAR levels.
Here, a particular mechanical component gets subjected to different stress levels , AND each stress level acting at different parts of the work cycle.
So, MINER developed an EQUATION in order to solve this problem.
The above equation finds use in these stress cycle cases.
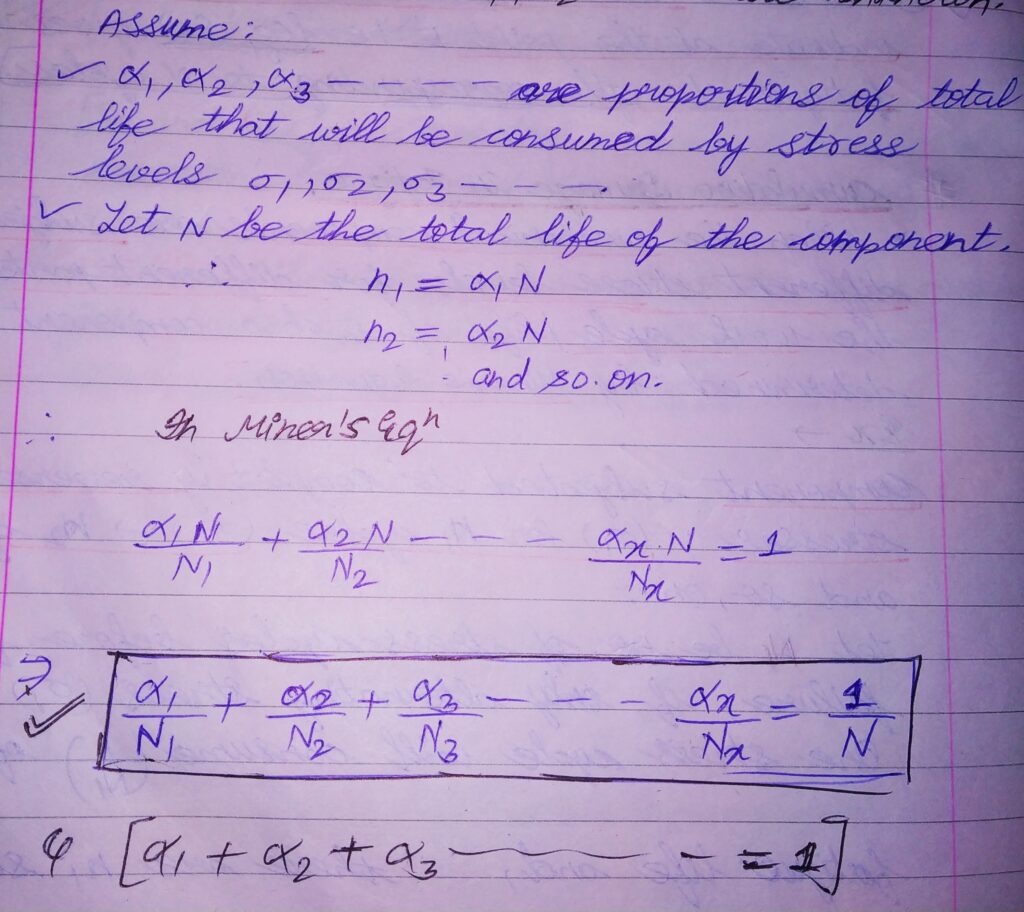
MINER’S EQUATION : FORMULA AND IT’S STUDY
Suppose we take a component ; subjected to various completely reversed stresses , each stress cycle acting for various no. of work cycles.
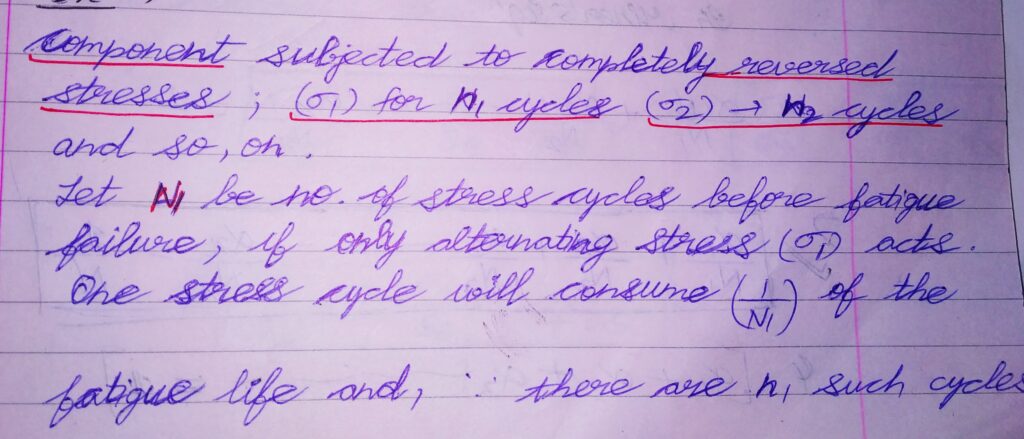
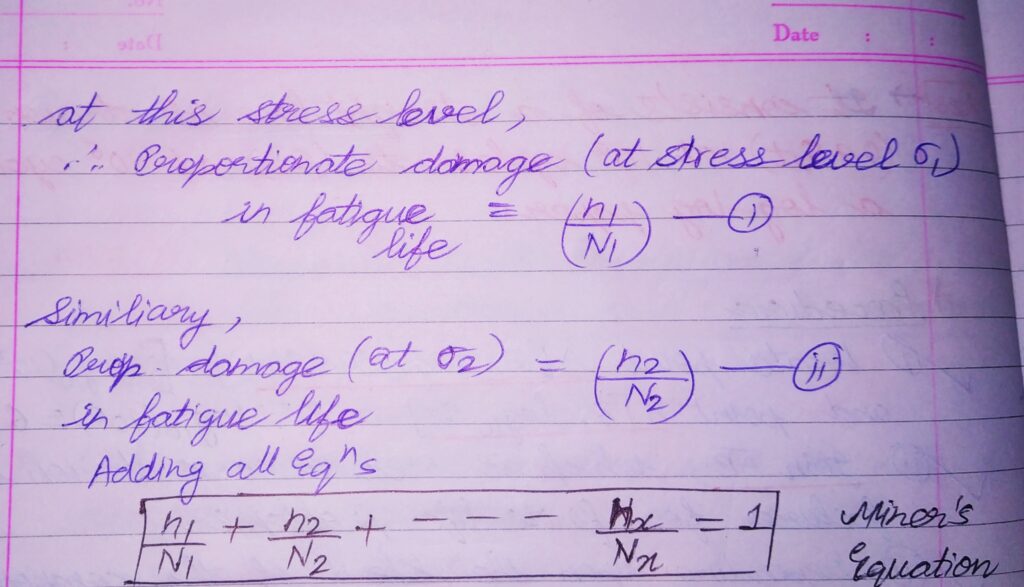
Now, suppose no. of cycles (n1,n2,n3,……) at respective stress levels (σ1,σ2,σ3,……) are unknown.
SOLVED NUMERICAL :
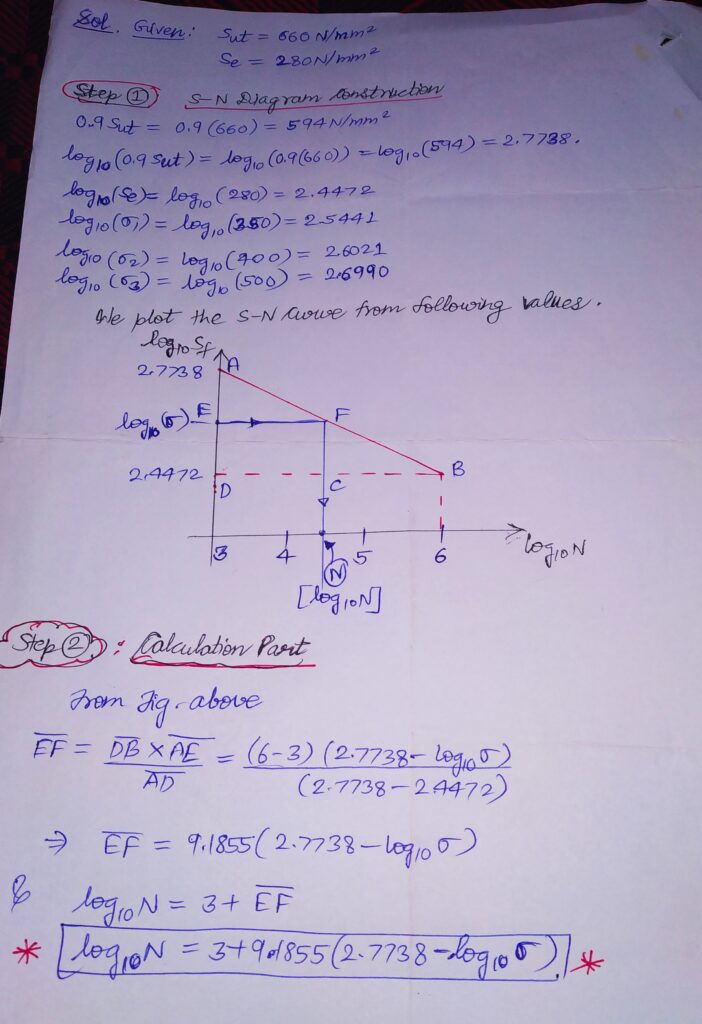
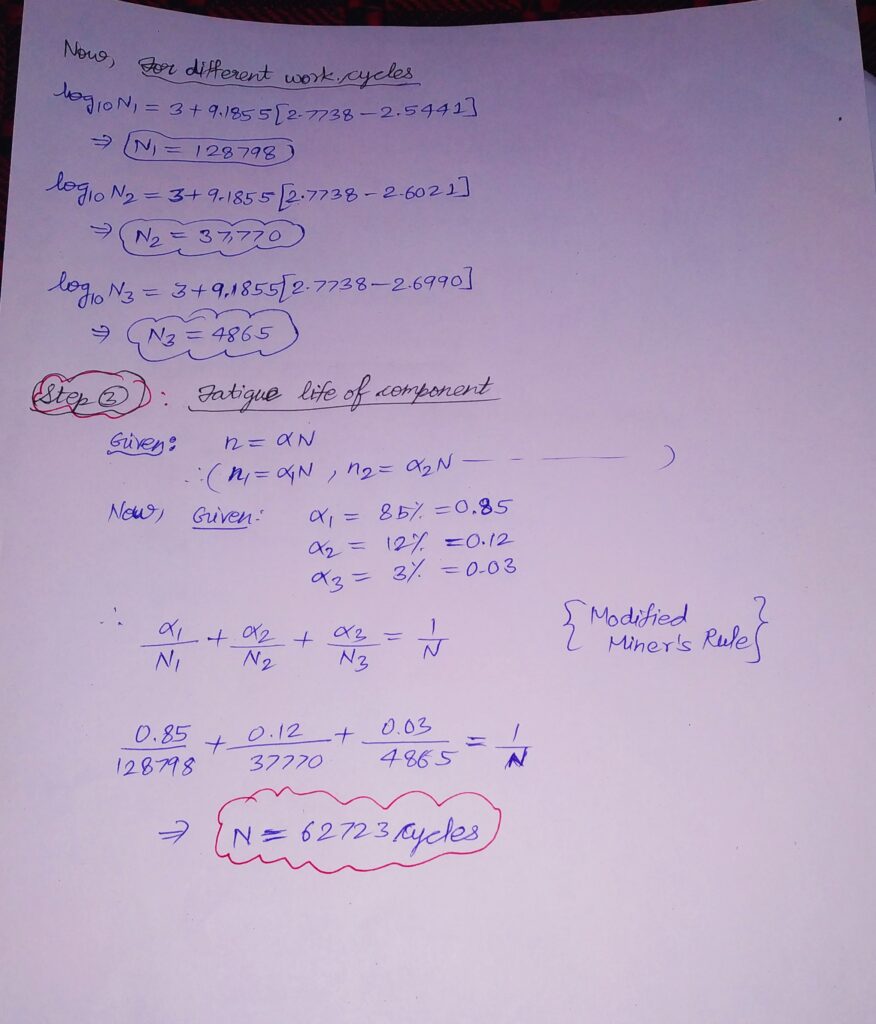
Q1. The work cycle of a mechanical component subjected to completely reversed bending stresses consists of the following three elements;
1) ±350 N/mm2 for 85% of time
2) ±400 N/mm2 for 12% of time
3) ±500 N/mm2 for 3% of time
Material and component is 50C4( Sut=660 N/mm2) and corrected endurance limit of the component =280 N/mm2.
Determine the life of the component.
THEORIES OF FAILURE (DYNAMIC LOADING):
For static loading , we learnt about 5 Theories of Failure (T.O.F) for designing in complex stress systems.
IF NOT SEEN TILL NOW, PLZ REFER TO THE LINK BELOW:
MORE BLOGS CAN BE VIEWED AT http://mechomotive.com/ .
But in fluctuating loading stress systems, design is quite different from others.
Fluctuating loading stresses : Those stresses which have different magnitude of stresses and also induces in a specific direction.
σm= σ1 +σ2/2 & σv = σ1 – σ2/2 where , σ1= maximum stress σ2= minimum stress
Here, we observed that MEAN STRESS {σm} component shows effect on the fatigue failure of a system when present in combination with alternating component.
So, we defined a set THEORIES OF FAILURE (TOF) for the fatigue loading systems.
The criteria for defining TOF for fatigue loading is mainly focused on S N curve characteristics.
S N CURVE CHARACTERISTICS STUDY (STATIC AND FATIGUE):
IN THIS ANALYSIS, we plot MEAN STRESS (σm) on x-axis (abscissa) and STRESS AMPLITUDE (σa) on y-axis (ordinate).
*** If σa=0 ; load is purely static and Criterion is either (Syt/σyt) or (Sut/σut). These limits plotted on the abscissa.
*** If σm=0 ; load is completely reversing and Criterion is Endurance limit (Se/σe) .This point plotted on the ordinate.
*** But when both are present ; σa & σm and are non zero, The actual failure is impossible to find out. And, the failure usually appears as different scattered points as shown in the figure.
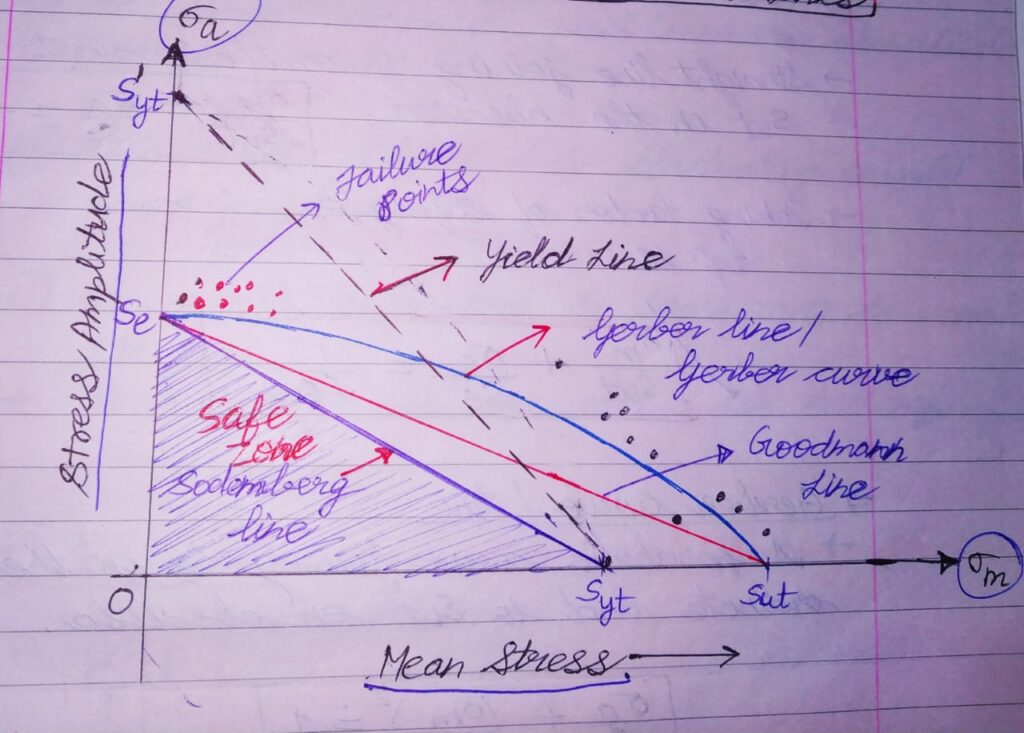
There exists a border in this graph .This border separates safe region from unsafe region for various combinations of σa & σm.
Different criterions came in existence to derive this safe region characteristics and these all in combination came to be known as “THEORIES OF FAILURE FOR FATIGUE LOADING”.
THEORIES OF FAILURE FOR FATIGUE LOADING kept for discussion in the next blog.
.


