


S N CURVE : INTRODUCTION
S-N CURVE : It implies a plot drawn between Stress Amplitude (Sf) and No. of stress cycles (N).
This curve basically plotted by identifying stress points and no. of cycle points at various intervals during rotation of shaft. Total interval usually taken from Central plane (i.e 00) to one full rotation (i.e 3600). Also, it implies one stress cycle completed by the specimen.
PLOTTING AND ITS RELATED TERMINOLOGIES :
Usually, in the FATIGUE TESTING MACHINE EXPERIMENT, the stress amplitude and no. of stress cycles taken and noted down until the appearance of first fatigue crack. And, these values plotted in the 2D along a rectangular coordinate plane. All these points when joined together gives a curve, called S N CURVE.
FOR THE CURVE :
X AXIS = NO. OF STRESS CYCLES (N) = log10N
Y AXIS = STRESS AMPLITUDE (Sf) = log10Sf
The graph system used is a LOG-LOG GRAPHICAL SYSTEM so that higher values of x and y can be plotted easily on a copy.
TERMS :
1) Sf= Stress Amplitude for a particular fatigue life (N)
2) Se= Endurance limit ( Max. Stress Amplitude for 106 cycles)
3) N= Fatigue life/Life of a component for a particular stress amplitude (Sf)
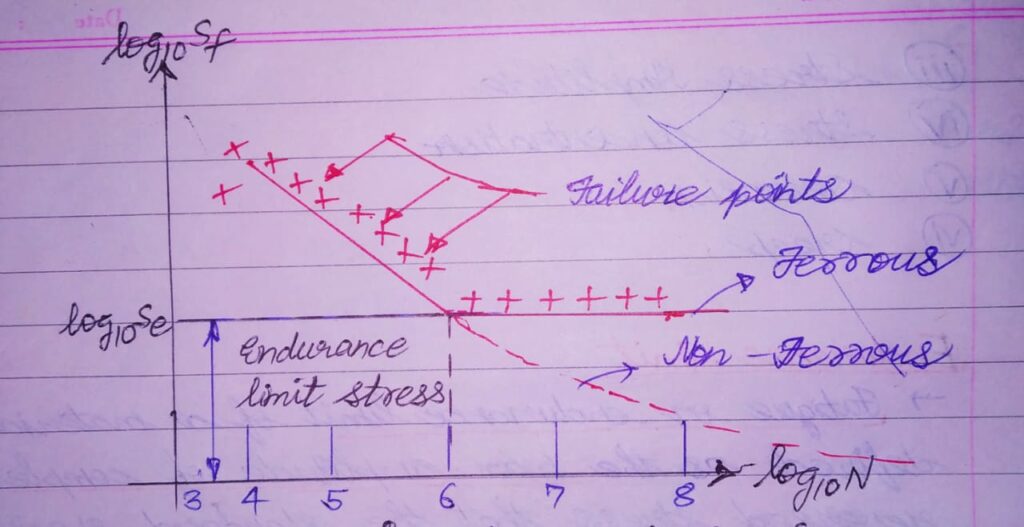
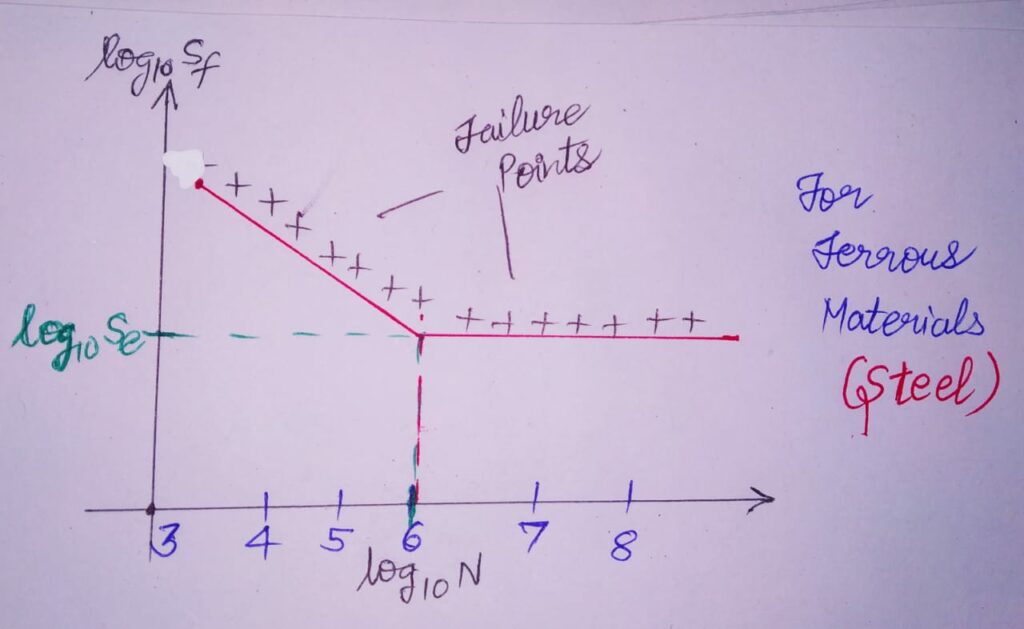
S N CURVE CHARACTERISTICS FOR FERROUS AND NON – FERROUS MATERIALS :
FERROUS MATERIALS : For ferrous materials like Steel, the S N Curve becomes asymptotic at 106 cycles. This point indicates the magnitude of stress amplitude corresponding to infinite no. of stress cycles. This stress amplitude indicates the ENDURANCE STRENGTH of the component ( i.e at 106 cycles).
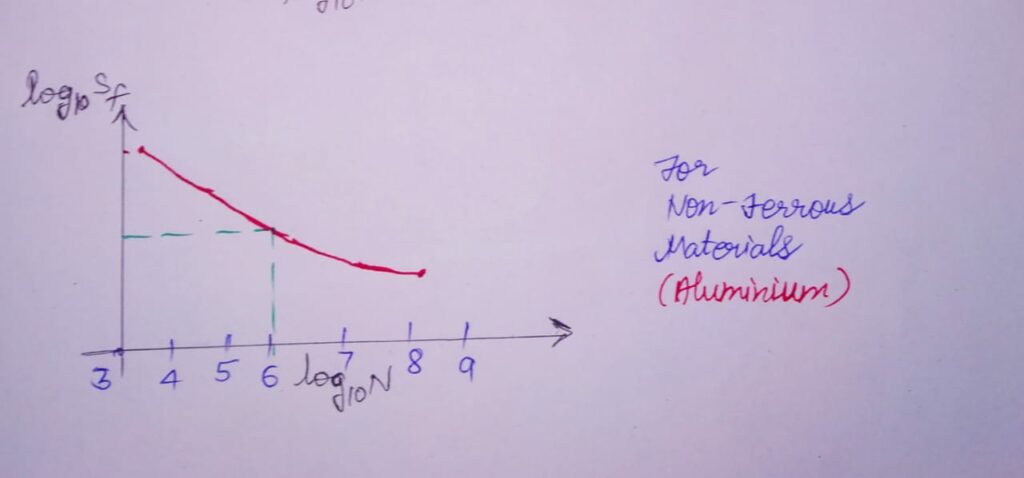
NON FERROUS MATERIALS : For non ferrous materials like Aluminium, the S N Curve gradually slopes over even after 106 cycles. So, Endurance Limit values are not distinct in these cases . For these materials , the Endurance limit stress usually represented as a function of No. of stress cycles.
Se= f(N)
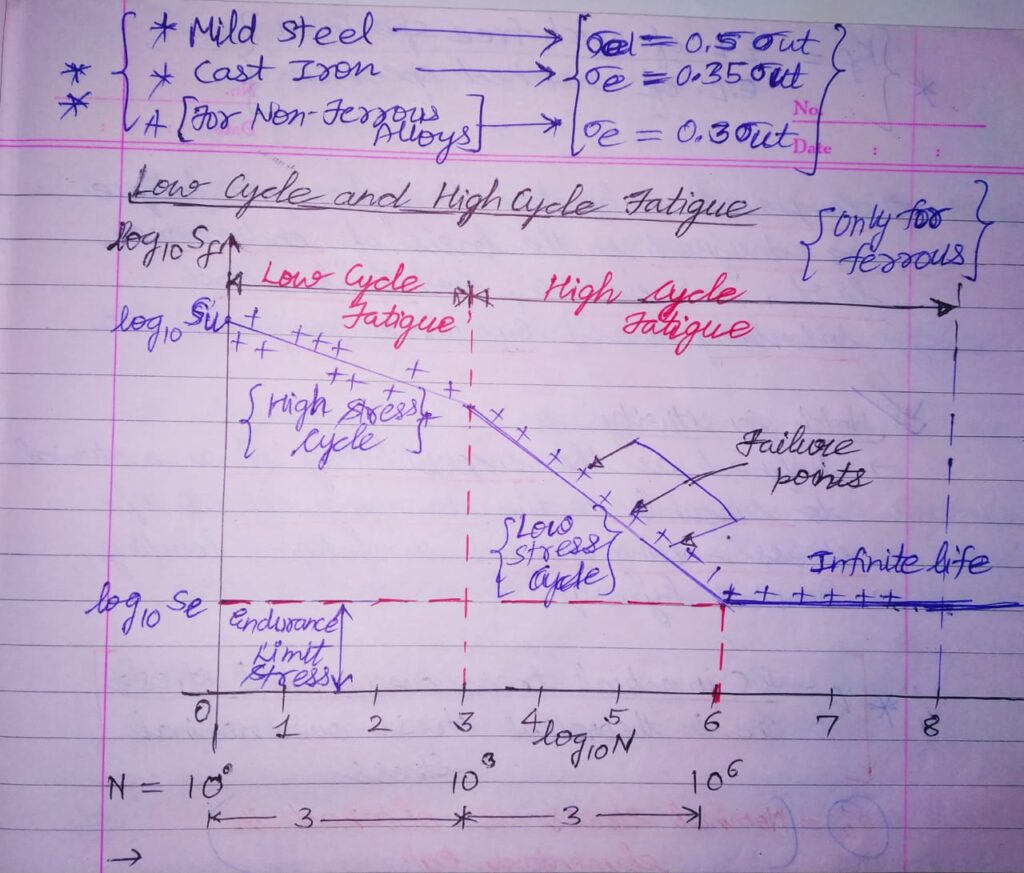
TYPES OF S N CURVE FATIGUE LEVELS :
1) LOW CYCLE FATIGUE LEVELS:
Any fatigue failure which has No.of stress cycles less than 103 (i.e N<103 or log10N<3).
Failure of studs on truck wheels, failure of setscrews for locating gears on shafts etc. shows some examples of this level of failure.
The design criteria for this fatigue level is always taken on the basis of Ultimate tensile strength and yield strength with suitable FOS.
2) HIGH CYCLE FATIGUE LEVELS:
Any fatigue failure which has No.of stress cycles more than 103 (i.e N>103 or log10N>3).
Failure of machine components such as springs ,ball bearings or gears with fluctuating stresses etc. shows some examples of this level of failure.
The design criteria for this fatigue level is usually taken on the basis of endurance limit stress.
S N CURVE and many other theories are used in the design analysis.
These theories will be discussed in the upcoming blogs.

