


In today’s growing world of challenges, one of the most difficult challenges we often see is Visualization of Data. This helps us to make in depth analysis and also makes us confident. Data Visualization is process of understanding the essence of data. This also helps us to clear the unwanting values as well as duplicates. Strategy to predict a situation totally depends on the analytical process. Handling data has become very important since year 2010.

It is very important for any data analyst to maintain the report of a huge dataset in efficient way. Many of us have seen that misreading or miss entering of data mostly happens in some organizations. That is the main reason why we are facing problems related to address, name, phone number, email etc. This only happens because of improper data management.
Data Visualization Tools
Data Visualization helps us to analyse data using graphs, charts, certain algorithms, mathematical formulas. These are the terms that are frequently used to scale data at organizational level. Python Programming makes data visualization easy by effectively by using it’s libraries.
What is the process for Data Visualization ?
1. Acquire: Obtain the data, whether from a file on a disk or a source over a network.
Data can be collected from many resources such as books, files and digital documents. This is the beginning and fundamental step of data visualization.
2. Parse: Provide some structure for the data’s meaning, and order it into categories.
You may have collected immerse data, but it is necessary to restructure the collected data. This structure will make it easier to know convey to others what data you have by format, tags, names, and indices.
3. Filter: Remove all but the data of interest.
Not all data is useful. Filter out the data that cannot serve your goal. If you are focusing on the data of a specific period, remove the data of other periods.
4. Mine: Apply methods from statistics or data mining as a way to discern patterns or place the data in mathematical context.
Data visualization is to help viewers seek for insights that may not be gained from raw data or statistics. This step helps get basic understanding of the data that is significant for the whole process.
5. Represent: Choose a basic visual model, such as a bar graph, list, or tree.
Various visual models are available. You need to select the suitable type that best suits your need. Edraw data visualization software helps you produce over 200 kinds of visuals instantly.
6. Refine: Improve the basic representation to make it clearer and more visually engaging.
Polish your work according to some basic color and graphic design theory. You can also rely on Edraw by just choosing one theme which includes harmonious color, font, and line style.
7. Interact: Add methods for manipulating the data or controlling what features are visible.
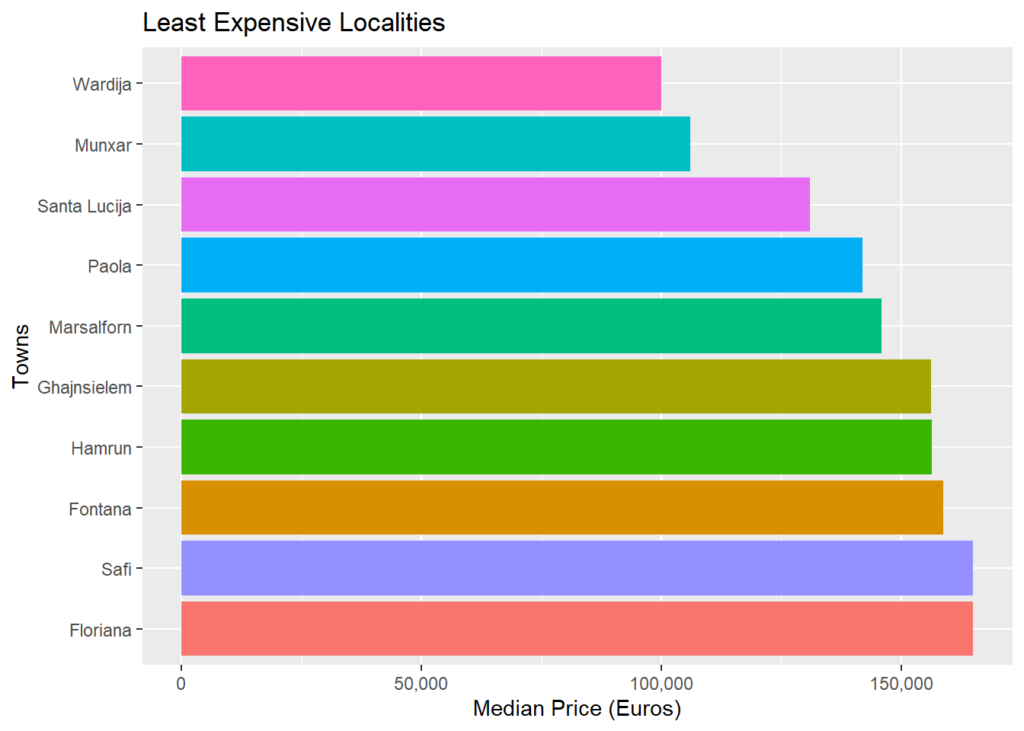
Example of Data Visualization
Please refer here for more help.


