


{FAILURE THEORIES/TOF} UNDER FATIGUE LOADING: STUDY AND ANALYSIS
Failure in components under fatigue loading are dealt with the S N curve analysis method.
S N curve in these stress systems plotted with following conditions :
MEAN STRESS(σm) on abscissa (x-axis) and VARIABLE STRESS (σV)/ STRESS AMPLITUDE(σa) ON ORDINATE (y-axis).
THEORIES OF FAILURE ( FATIGUE LOADING):
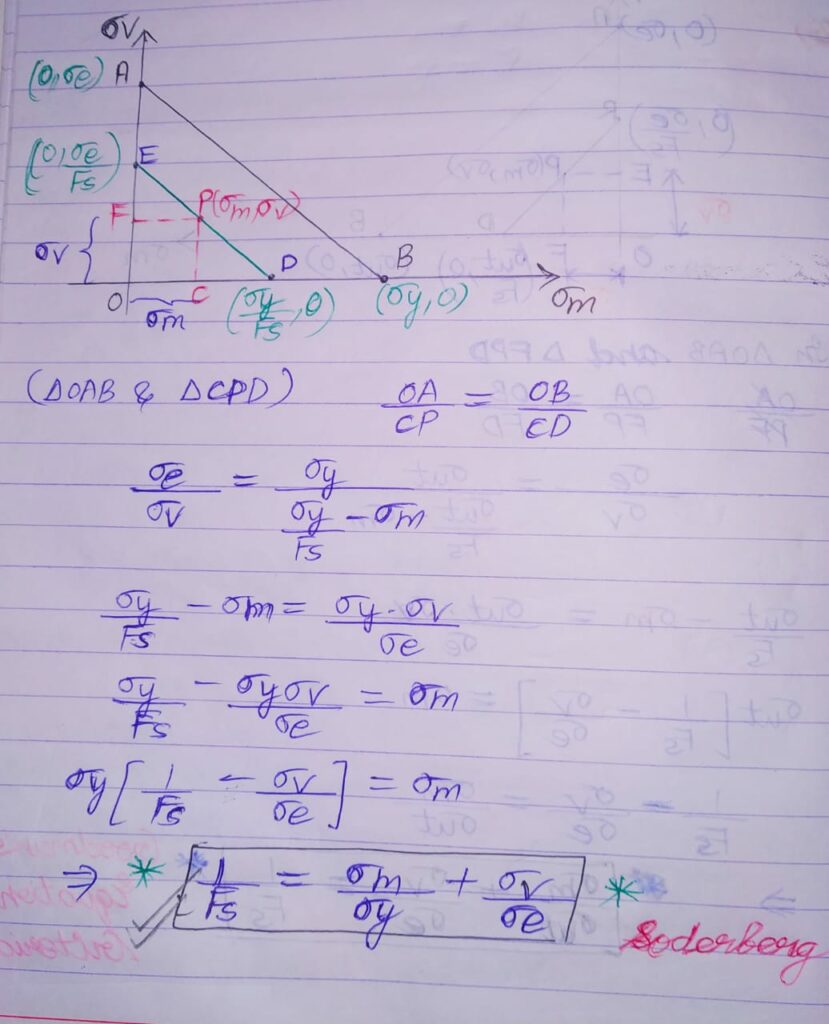
1)SODERBERG LINE:
*A straight line which joins σe on ordinate (0, σe) to σyt on abscissa (σyt,0) .
*Analysis based on the Yield Strength(σyt) of the material.
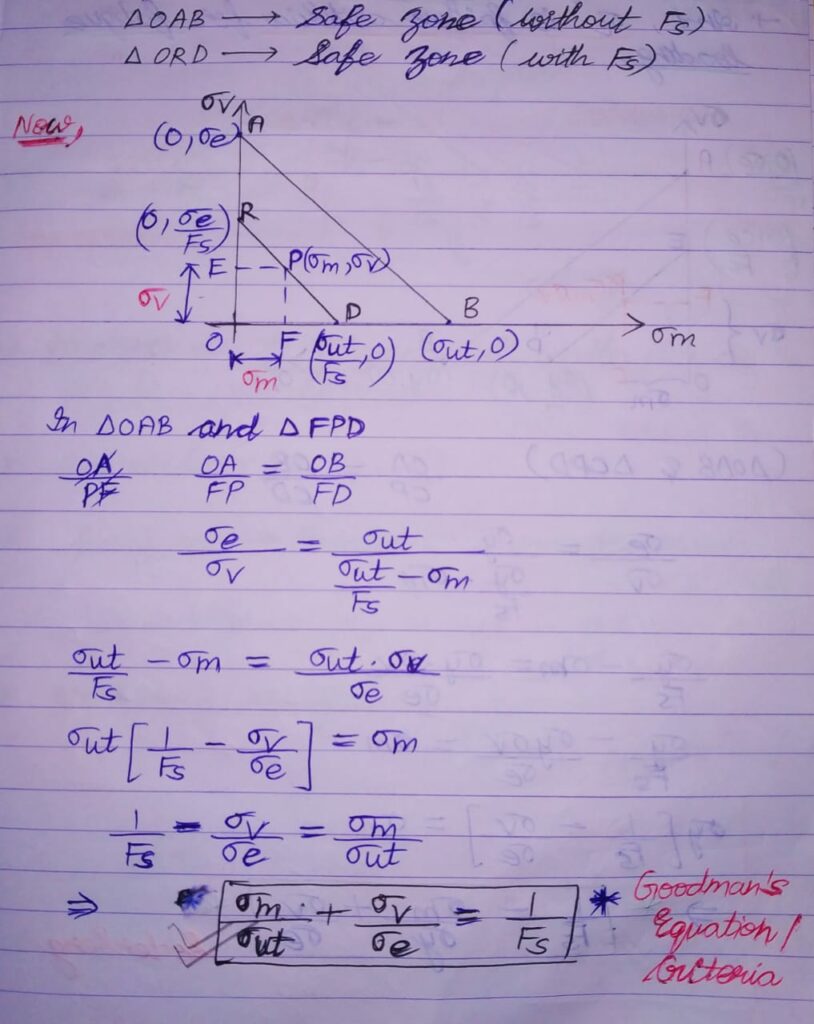
2)GOODMAN LINE:
*A straight line which joins σe on ordinate (0, σe) to σut on abscissa (σut,0).
*Analysis based on the Ultimate Strength(σut) of the material.
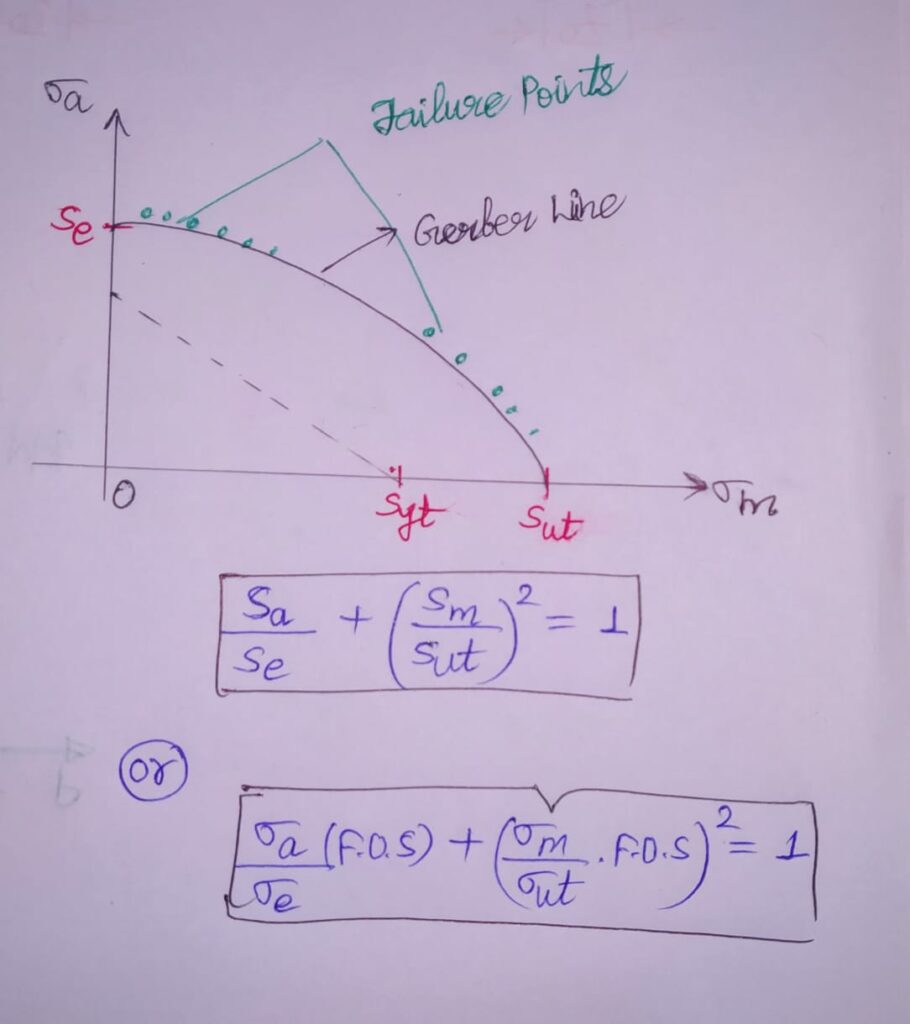
3)GERBER LINE/CURVE:
*A parabolic curve which joins σe on ordinate (0, σe) to σut on abscissa (σut,0).
*Analysis based on the Ultimate Strength(σut) of the material.
COMPARISON BETWEEN DIFFERENT TOF’S (FATIGUE FAILURE) :
According to analysis, we see that the GERBER PARABOLA best fits the failure points of test data in the plot.Whereas, we see that the GOODMAN LINE fits beneath the scatter data.Both GERBER as well as GOODMAN have same coordinates of line.
But, according to design considerations; GOODMAN LINE preferred because it fits well inside the Gerber parabola curve.
For SODERBERG LINE, it becomes a more conservative failure criterion, since it is based on the Yield strength of component.
In this ,the SODERBERG line ;often called limit on “FIRST CYCLE” of stress shows failure in yielding ; regardless of FOS value.
CONCLUSION:
GOODMAN LINE GETS PREFERENCE IN DESIGNING PROCESS DUE TO FOLLOWING REASONS:
1)Goodman line mainly safe from design considerations, since it is completely inside the failure points of test data.
2)Equation of Straight line leads to easy calculations in comparison to the Parabolic curve.
3) Scale diagram and rough sketch not required for analysis.
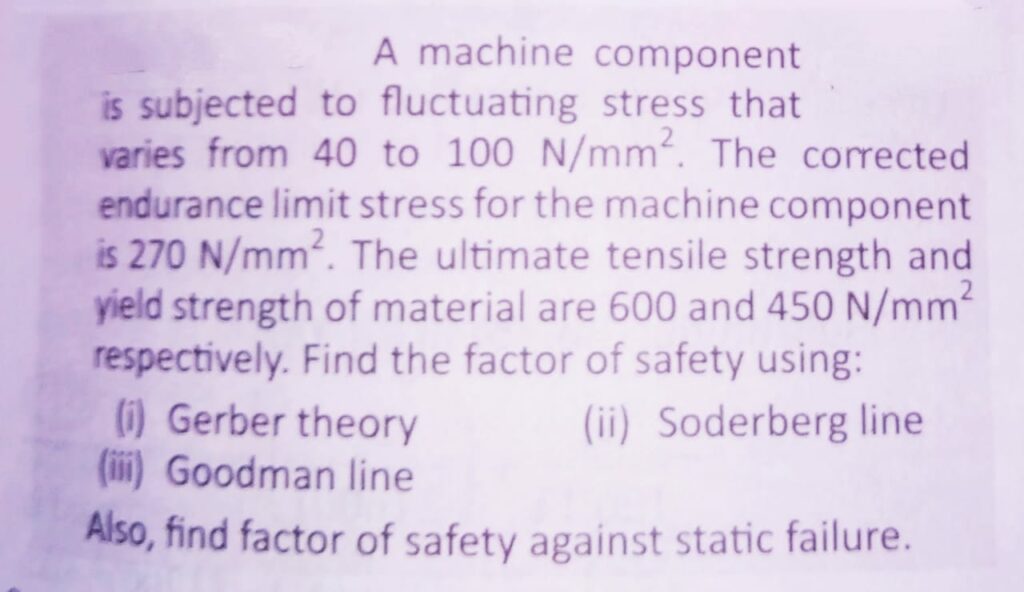
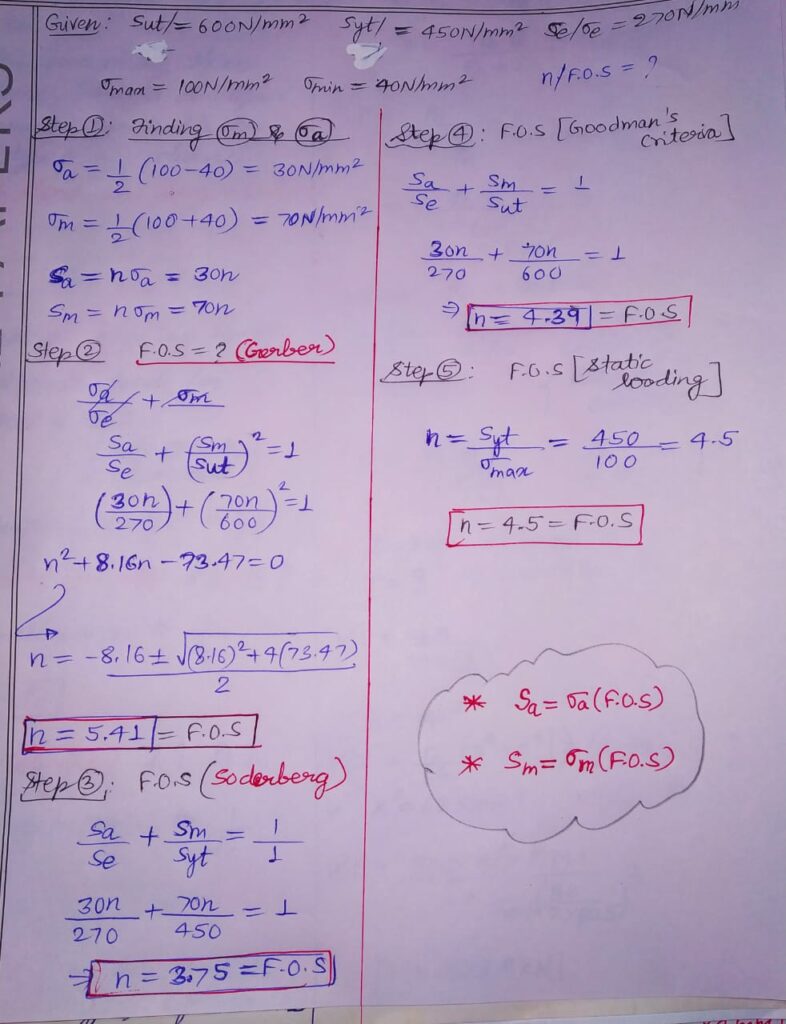
LET’S SEE A NUMERICAL BASED ON THESE CONCEPTS AND FIND OUT THE SAFEST DESIGN AMONG ALL THESE.
SOLVED NUMERICAL:
MODIFIED GOODMAN DIAGRAMS:
There is another concept called MODIFIED GOODMAN DIAGRAMS; whose analysis is given in the link below:

